複素数の素数 分布編
素数の分布
複素数の素数の具体的な数
複素数の素数の数と割合を見てみよう
| 半径R | 複素整数の個数 | 素数の個数 | 割合 |
|---|---|---|---|
| 10 | 314 | 100 | 0.318 |
| 50 | 7854 | 1476 | 0.188 |
| 100 | 31416 | 4928 | 0.157 |
| 1000 | 3141592 | 313752 | 0.100 |
| 2000 | 12566370 | 1132640 | 0.090 |
| 5000 | 78539816 | 6263384 | 0.080 |
| 10000 | 314159265 | 23046512 | 0.073 |
複素数の素数の分布のグラフ
横軸が実軸で縦軸が虚軸である。
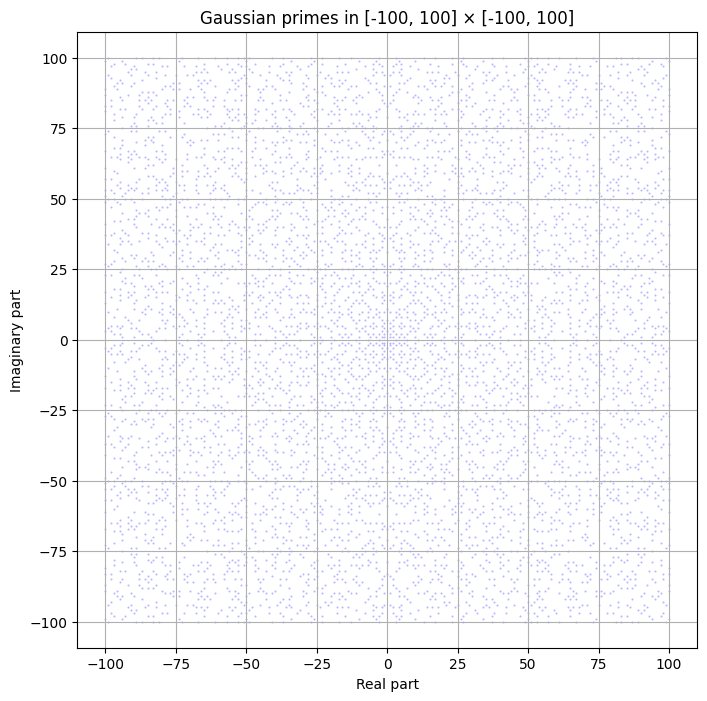 素数の分布のグラフ
このグラフから上下左右対称になっていることがわかる。
なお計算やグラフの生成は$c++$を利用した。
計算のコード
#include <bits/stdc++.h>
using namespace std;
vector prime_axis;
// ---- 軸用の素数表(0〜R) ----
void sieve_axis(long long R) {
prime_axis.assign(R + 1, true);
prime_axis[0] = prime_axis[1] = false;
for (long long i = 2; i * i <= R; ++i) {
if (prime_axis[i]) {
for (long long j = i * i; j <= R; j += i)
prime_axis[j] = false;
}
}
}
bool is_prime_axis(long long n) {
return prime_axis[n];
}
// ---- ノルム用の素朴な素数判定(高速)----
bool is_prime_norm(long long n) {
if (n < 2) return false;
if (n % 2 == 0) return n == 2;
long long r = sqrtl(n);
for (long long p = 3; p <= r; p += 2) {
if (n % p == 0) return false;
}
return true;
}
long long count_gaussian_primes(long long R) {
long long R2 = R * R;
long long cnt = 0;
// ---- 軸上 ----
for (long long x = 1; x <= R; ++x) {
if (is_prime_axis(x) && (x % 4 == 3)) {
cnt += 4;
}
}
// ---- 第1象限 ----
for (long long a = 1; a <= R; ++a) {
long long max_b2 = R2 - a * a;
if (max_b2 <= 0) continue;
long long limit_b = sqrtl(max_b2);
for (long long b = 1; b <= limit_b; ++b) {
long long n = aa + bb;
if (is_prime_norm(n)) {
cnt += 4;
}
}
}
return cnt;
}
int main() {
long long R = 100000;
sieve_axis(R); // メモリ使用量は R バイトだけ
cout << count_gaussian_primes(R) << endl;
return 0;
}
##グラフのコード
import math
import matplotlib.pyplot as plt
# ===== ガウス素数判定 =====
def is_prime(n):
if n < 2:
return False
if n == 2 or n == 3:
return True
if n % 2 == 0:
return False
r = int(math.isqrt(n))
for i in range(3, r+1, 2):
if n % i == 0:
return False
return True
def is_gaussian_prime(a, b):
if a == 0 and b == 0:
return False
aa, bb = abs(a), abs(b)
# 実軸・虚軸上
if a == 0 or b == 0:
x = bb if a == 0 else aa
return is_prime(x) and (x % 4 == 3)
# ノルムが通常の素数
N = aa + bb
return is_prime(N)
# ===== 範囲設定 =====
LIMIT = 500 # 必要なら 3000, 5000 と広げられる
pts = []
for a in range(-LIMIT, LIMIT+1):
for b in range(-LIMIT, LIMIT+1):
if is_gaussian_prime(a, b):
pts.append((a, b))
# ===== プロット =====
xs = [p[0] for p in pts]
ys = [p[1] for p in pts]
plt.figure(figsize=(8,8))
plt.scatter(xs, ys, s=0.3, color="blue", alpha=0.25) # ★透明度つき
plt.title(f"Gaussian primes in [-{LIMIT}, {LIMIT}] × [-{LIMIT}, {LIMIT}]")
plt.xlabel("Real part")
plt.ylabel("Imaginary part")
plt.grid(True)
plt.axis("equal")
plt.show()


この記事を高評価した人
この記事に送られたバッジ
投稿者